
If in previous page was information about when to heat then in this page is about how to regulate heating if it is already turned on.
As a background information I will list few relevant notes about current heating system setup in my apartment building:
- It has water-based, two pipe central heating system which is divided into 7 sections each having its own regulating/balancing valve (manually adjustable).
- All radiators (33 pcs) are quite large and after renovation it was possible to decrease water temperature in heating system to save energy. In other words – because of the reduced heating requirements radiators are radiating enough heat already in much lower water temperatures.
- All radiators are equipped with thermostat regulators which cut the flow through radiators if room temperature is high enough. Thermostat’s have limiters set and allow manually adjust temperature in a range ~16-24 degrees Celsius.
So, generally what the heating system has to do is to supply heating water with “high enough” temperature and thermostats on the radiators do the rest. Heat will just go where it is needed. That is of course if sections are more or less in balance. As this “high enough” temperature depends on outside temperature, you have to draw a line or so called heating curve.
Heating curve
Heating curve shows how high must be supplied heating water temperature to cover heat losses through walls, windows, ventilation etc. on different outside temperatures. Heating curve is different for different houses and/or houses having different level of renovation. Its quite hard to adjust it manually so usually there are some “black boxes” which adjust heating automatically by following the curve and opening or closing valves. These black boxes unfortunately are either expensive or lack some functionality like remote access/control, possibility to choose between several heating sources and heating curves etc.
Why its important to find correct heating curve for your house and follow it?
- If you supply lower temperature than required to your heating system, some or all radiators may not radiate enough heat to cover heating losses. If you have cold in your house although radiators are warm, you may want to increase the temperature by adjusting heating curve.
- If you supply higher than needed temperature to your heating system, you waste energy by raising water temperature more than it is needed. Also losses from pipes increase. Some heating sources coefficient of performance decreases if you increase temperature, most common example of such heating source are heat-pumps.
Current “Black box” in my apartment building is Sauter NRT 114 which is not sufficent for my needs although it is actually white. It drives only one valve based on outside temperature, heating water temperature and selected heating curve slope. It does not have remote access possibility, fine-tuning or heating source selection possibilities. If I wanted to save energy, I had to run to basement and manually adjust heating curve slope. I did it couple of times but its just waste of quality beer-drinking time. Example of slope adjustment below. Before renovation most commonly used slope was around 1.4, after renovation 0.8.
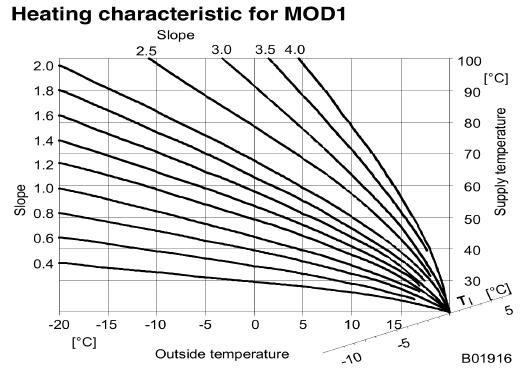
Sauter AG „NRT 114: Electronic heating controller“ http://www.sauter-controls.com/pdm/docs/en_ds_en525856.pdf
Shortcomings of the current regulator were the initial driving force to start regulating heating in a more controlled and precise way using Raspberry Pi and some extra hardware. At first RPi was installed to basement to collect temperature data. Based on the data collected, I was able to make a chart illustrating average heating curve after renovation was completed.
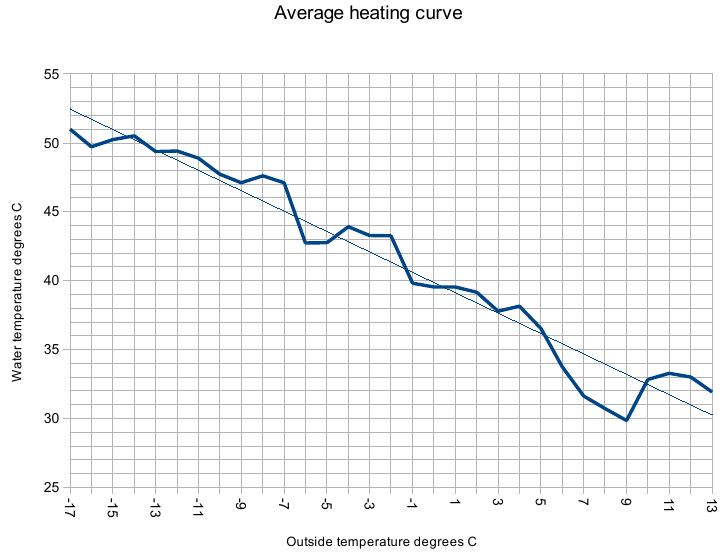
As visible it is not very smooth curve but the trendline is what I am after. I will use that trendline to create first heating curve what to use as baseline.
If you found this useful, say thanks, click on some banners or donate, I can always use some beer money.
Next thing to read would be about temperature data collection